Our Sustainability Report Is Out! Here’s What It Says And Why It’s So Important to Our Business

We are proud to announce that our sustainability report for the year 2021 is complete!
It has not been easy capturing the data and making changes toward a more sustainable future, but we are so proud and excited to share what we’ve been able to accomplish so far.
There is a lot of information in this report, so we wanted to break it down and talk about what it means and how we plan on using it.
Why did we decide to do this?
Since 2020, we have been working hard to create our own path toward sustainability.
As a fourth-party logistics provider, CBIP does not emit the actual GHGs (greenhouse gases) with its own facilities. Rather, the emissions are produced by the logistics providers in our network spanning 10 different nations, namely: Hong Kong, China, Taiwan, Vietnam, Singapore, the Philippines, Australia, the USA, the UK, and the Netherlands.
Dealing with the emissions from the numerous partners in our network presents both an added challenge and a unique opportunity.
The challenge is that there are many moving parts to keep track of. The opportunity is that our unique position as a 4PL allows us to orchestrate sustainable goals for everyone in our partner network.
At CBIP, we’ve decided to take advantage of that opportunity and position ourselves as a leader in sustainability.
Our strategy
With the help of our sustainability partner South Pole, we began outlining our goals for this report.
Broken down into three parts, the goals of this report were to:
- Identify our largest contributors to GHG emissions
- Figure out what opportunities there are for carbon offset projects
- Form a strategy for lowering our overall emissions in the long term
Next, we got started putting together an audit for the year 2021 using the following steps.
- Collect data from all of our partners
- Create a report on carbon emissions from all partners with the help of South Pole
- Analyze that report to see what carbon offset projects we can support
- Provide that info to our partners on their emissions and provide options on how they can improve or projects they can invest in to offset
- Lead the way by investing in continuous improvement and getting the word out about what we are doing
How to read CBIP’s 2021 sustainability report
Glancing over the 35-page report, you see many numbers, different terms, and various colorful graphs.
The data is broken down in a variety of different ways throughout the 35 pages. You’ll see graphs and charts outlining info on the emissions created by CBIP’s actions, broken down by date, client, provider, type of freight, and methodology on how that data was collected.
Looking at something like this, it’s easy for your mind to go blank, overwhelmed by the volume of data.
To simplify things, let's break it down and take a look at some of the key elements.
Glancing at the report, you can see:
- The executive summary on page 7, where CBIP’s total greenhouse gas (GHG) emissions are tallied up
- Methodology on page 9, showing how data was collected, and which elements of a client or provider’s actions were included in the data

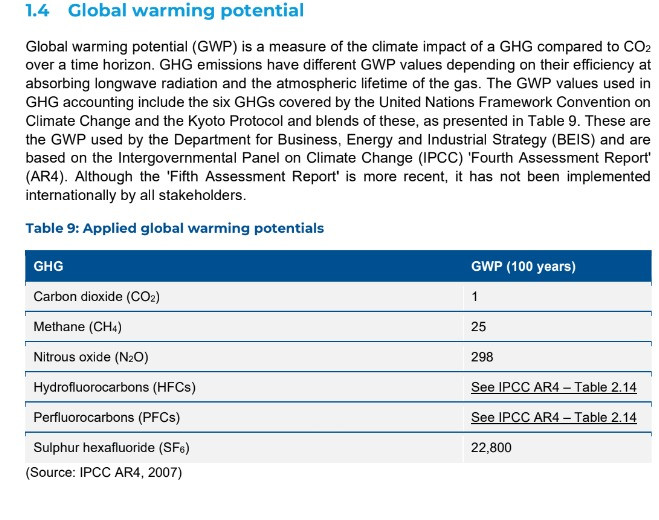
- A section on the global warming potential on page 14 shows the potential long-term impact of our emissions
- Greenhouse gas emissions by scope and activity are on page 15, which shows how different elements like company use of electricity, heating and cooling, employee commuting, and sea, road, and air freight, are factored into the total emissions. Below that, the report analyzes freight emissions by month and by freight mode as well, since they are by far the most polluting activities (around 98% of our emissions coming from freight transport)
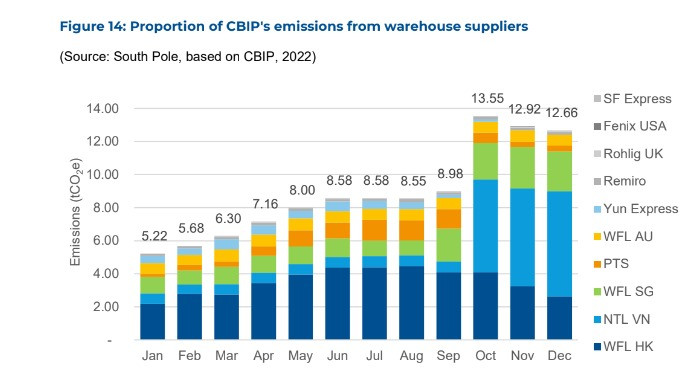
- Starting on page 19, freight emissions are analyzed and broken down by logistics supplier
- On page 20, the same freight analysis is done, this time broken down to show which clients contributed what
The tools we used
The greatest asset we have here is our sustainability partner, South Pole.
Back in 2020, we came to them and outlined some of our sustainability goals and hopes for the future of our company and the industry as a whole. From there, South Pole has been helping us by recommending carbon capture projects we can take part in — projects that are located in the regions where our emissions are created.
South Pole also helps us by compiling and analyzing data we give them on our actions; this is one of the key ways they are able to calculate the emissions associated with our operations every month.
Another important tool we use is a mandatory monthly activity report that we require from all of our partners. Each month, we require our partners to submit a report on things like electricity used in warehouses, distance traveled using various modes of freight, and employee commute data.
We send this data to South Pole, and South Pole calculates their emissions and gives suggestions on how to cut down on emissions, etc.
Getting good data: Where can we improve?
Having good and accurate data is crucial to getting a good report, but it's far from an easy thing.
You have to have a strategy for collecting data from your partners, and the people you work with have to have a good strategy for collecting accurate data. Page 13 breaks down areas of consumption and how we can improve transparency to get better data.
This includes collecting exact addresses of origin and destination city, or at least a postcode, providing IATA code for air freight, and breaking down sea freight into monthly data for a more granular analysis.
There are areas where data was lacking, and we hope to continue to improve. However, models and estimations can work wonders for creating an accurate picture of our overall emissions.
What we do next is what counts
We are trying to set an example and create a better option for e-commerce retailers looking for a logistics provider that is setting sustainability goals and making real changes.
We want to take responsibility for the emissions that are created as a result of our business, but we also want to give our partners the opportunity to improve by providing them with info on their part of the emissions and keeping them accountable.
We hope that this inspires our partners to foot some part of the bill in the future, whenever they are able to. Above all, we hope our actions help all of our partners — the e-commerce retail clients and the logistics providers — to create businesses that they can be proud of, and that their customers can feel good about purchasing from.
We aren’t just trying to do — we also want to lead. A big part of our work is communicating what we are trying to do in terms of sustainable action, and hopefully inspiring others in the industry to do the same.
If you are a fan of what we are trying to do, particularly if you are in the logistics industry in the Asia Pacific region, pass on the message by sharing this article. Or, take a page out of CBIP’s book and draw up your own sustainability roadmap.
To take a look at the actual report, head over to our sustainability page and scroll down to the bottom to download it for free.
If you would like to find out how your e-commerce company can join forces with CBIP to create more sustainable logistics, give us a call for a free consultation.


